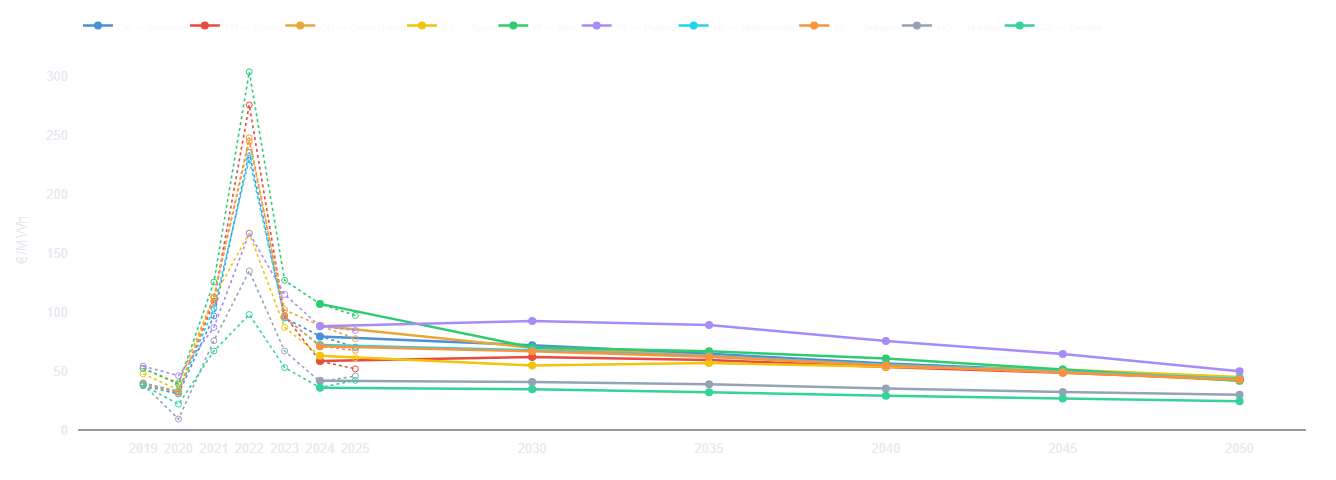
Hourly LP dispatch · ENTSO-E TYNDP 2024 · 10 EU markets

Customisable, transparenthourly power price curves to 2050+.

PowerLens is a web app that models European wholesale power prices, hour by hour, out to 2050 — and lets you change every assumption behind them. Ten markets, all 8,760 hours of every year, on a model you can see inside, adjust in seconds, and defend in a data room.

Built for renewable and storage investors — solar, wind and battery developers, IPPs and funds whose returns depend on the merchant price.

Markets FRDEGBESITPLNLBENOSE
app.powerlens.io · Europe Overview
PowerLens app — hourly day-ahead price forecast to 2050 across ten European markets, with a P10–P90 confidence band.
The live app — every price comes from an hourly merit-order dispatch you can trace and adjust.
8,760
Hours modelled per year
€0.1/MWh
2024 in-sample backtest error
2050→ 2065
Default horizon, extendable
10
European markets, one engine

A model you can see inside
not a forecast you rent.

PowerLens clears all 8,760 hours of a year, per market, out to 2050, from a transparent stack of generation and storage. Every price traces back to the plant that set it. You set the assumptions; the engine does the rest, in seconds.

Hourly, to 2050

Capture rates, spreads, negative-price hours and cannibalisation — not just an annual average.

Your assumptions

Fuel, carbon, demand, nuclear, storage — and solar / onshore / offshore wind independently.

Open & auditable

PyPSA + HiGHS, calibrated to ENTSO-E, IRENA, Ember and Eurostat. Public data, every source cited, and the known limitations stated up front.

Three scenarios out of the box.
Then bend any of them.

Every run starts from one of three ENTSO-E TYNDP 2024-aligned pathways — a defensible base case and a bracket either side of it. None of them is fixed: every input behind them is a slider you can move.

Downside for prices
Accelerated Transition
Aggressive VRE build-out, high BESS deployment and strong carbon pricing. More zero-cost supply pushes prices down and deepens cannibalisation.
2030 EU-10 avg55€/MWh
Base · Reference
Current Trends
The central case: full TYNDP National Trends. Balanced solar and wind growth, moderate storage, gas as the backstop. The defensible baseline.
2030 EU-10 avg64€/MWh
Upside for prices
Delayed Transition
Slower solar and wind rollout, higher fossil dependency. Gas stays on the margin longer, so wholesale prices hold higher.
2030 EU-10 avg66€/MWh

Defaults, not limits. Tilt gas, CO₂, demand, nuclear and storage inside any scenario — and scale the VRE build-out as a whole or per technology, solar, onshore and offshore wind independently. Save the result, name it, and compare it against the defaults side by side.

Built for the people who
have to defend the number.

PowerLens models day-ahead wholesale prices — the merchant revenue that renewable and storage assets actually earn — and takes it all the way through to the investment case.

IPPs & asset owners
Merchant tail & PPA pricing

Stress-test merchant tail value and PPA pricing against a transparent, adjustable curve — not a single vendor number.

Infra funds & M&A
Deal screening

A fast, independent second opinion for screening and cross-border allocation, without the cost or lead time of a full bankable study.

BESS & storage devs
Storage revenue modelling

Day-ahead spread and LCOS-vs-revenue margin by market and year, to identify where and when storage actually pays back.

Project finance
NPV / IRR / LCOE

Unlevered Monte-Carlo project distributions, per asset, ready to sit alongside your own financing model.

And who it isn't for. PowerLens models wholesale day-ahead prices only — no retail build-up (network tariffs, levies, taxes), so it is not intended for end-consumer cost analysis. It is a second opinion and a screening tool, not a lender reliance-letter curve.

Send us the market,
we'll send back a curve.

Tell us the market, technology and horizon you need, and we'll return a sample hourly price curve — built on the same transparent engine.