Scenarios & method

Three pathways,
built on national plans and the decided pipeline.

Each pathway leads to the number that drives your returns: the wholesale price your assets capture. The engine is identical in all three. Only the inputs change.

app.powerlens.io · Scenario Comparison
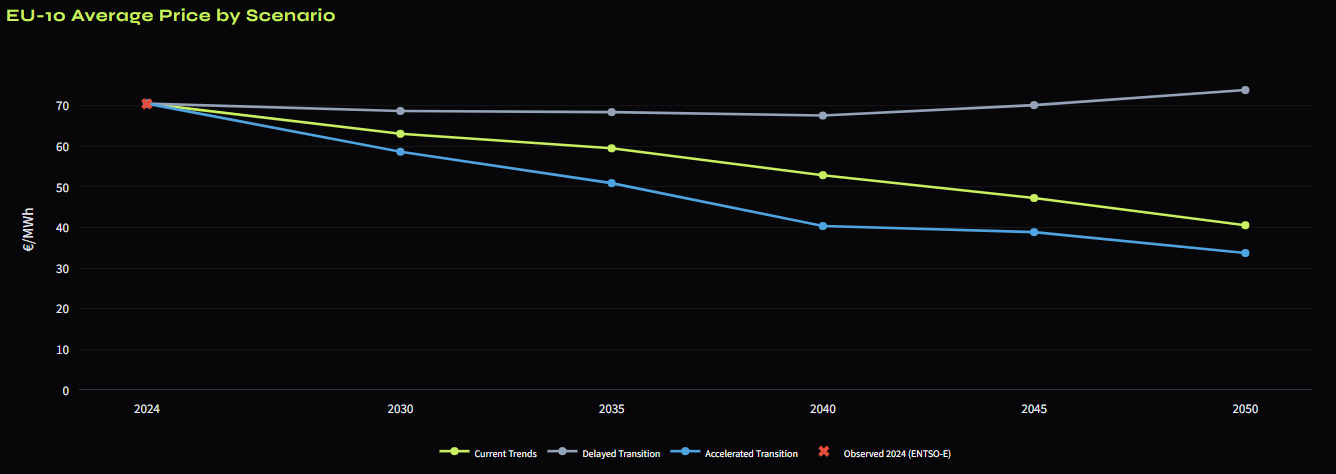
EU-10 average price by scenario to 2050 — Current Trends, Accelerated and Delayed Transition, with observed 2024.
EU-10 average day-ahead price by scenario. The central case moves from ~73 €/MWh (2024) toward ~63 €/MWh by 2050, in 2024 euros like every figure on the chart, with the other two scenarios a clean bracket around it.
Downside for prices
Accelerated Transition
The pipeline's high end, with TYNDP Distributed Energy demand: aggressive VRE build-out, high BESS deployment and strong carbon pricing. More zero-cost supply pushes wholesale prices down and deepens cannibalisation — the squeeze on capture rates.
2030 EU-10 avg61€/MWh (2024 €)
Base · Reference
Current Trends
The central case: national plans and the decided pipeline, TYNDP where no plan exists. Balanced solar and wind growth, moderate storage, gas as the backstop. The defensible baseline most investment cases start from.
2030 EU-10 avg64€/MWh (2024 €)
Upside for prices
Delayed Transition
The decided pipeline only, with TYNDP's lower-economy demand: lower solar and wind rollout and higher fossil dependency. Gas stays on the margin longer, so wholesale prices hold higher — the upside case for merchant revenue.
2030 EU-10 avg66€/MWh (2024 €)

Upside and downside are framed from your point of view — higher wholesale prices help merchant returns, faster clean build-out squeezes them. Tilt the supply build and commodity prices within any scenario — down to individual VRE technologies — or commission a fully custom one.

From historical data to an
hourly price, in four steps.

The same engine runs every scenario, and every input it uses is visible on screen.

01 · Calibrate
Anchor to reality

Hourly prices, capacity and demand from ENTSO-E, IRENA, Ember, Eurostat: 2024 hindcast to a mean error of 0.10 €/MWh (on the observed 2024 weather), in sample.

02 · Set assumptions
Every input is a slider

Fuel & CO₂, demand, nuclear, BESS and per-technology VRE — all visible and adjustable.

03 · Dispatch hourly
Clear 8,760 hours

A merit-order LP (PyPSA-Eur formulation, HiGHS solver) clears every hour, per market, per year to 2050 — ~15s/year, cached in under 10.

04 · Quantify risk
Ship a confidence band

Monte-Carlo weather re-draws turn a single curve into a P10–P90 band — every output ships with its interval.

Transparency includes the limitations. The model currently over-states how much of the day-ahead price a solar plant captures in France, Poland, the Netherlands and Belgium — by 3 to 17 percentage points against 2024 outturn — so a solar PPA in those markets looks better on our numbers than in the market. Quantified per zone in the methodology, stated up front, so sophisticated buyers can weight it themselves. Every assumption is yours to set, and every data source is publicly cited.

Bend a scenario to your thesis,
or commission a custom one.

Run the three pathways yourself, tilt any assumption, or have us scope a bespoke scenario around your asset.