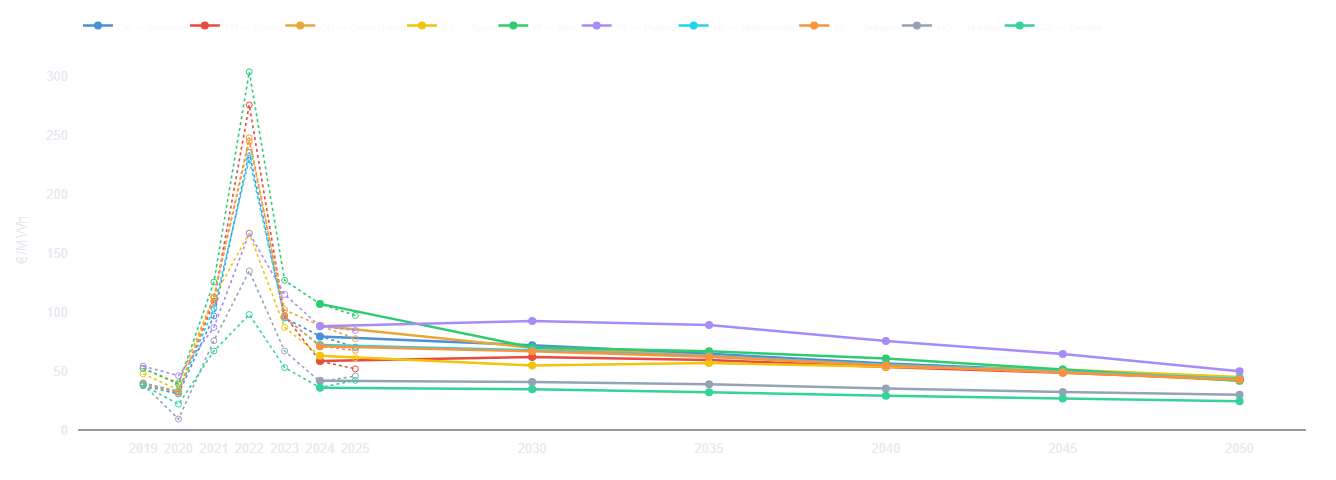
Solar in Spain or Germany? A battery now or in 2028, two hours or four? PowerLens prices all 8,760 hours of every year in ten markets and turns them into what an investment committee reads: captured prices, battery revenue stacks, NPV and IRR. Move the gas price, the carbon price or the build-out, and every number re-clears.
For developers, IPPs, infrastructure funds and project-finance teams deciding where merchant capital goes.
Each is a screen in the app, and every figure on it traces back to a specific hour and the plant that set the price in it.
PowerLens models the wholesale day-ahead price — the revenue a merchant renewable or storage asset actually earns.
Price a PPA, and value the merchant years after it expires, against a curve you can adjust and explain.
An independent second view in an afternoon, before committing to a full bankable study.
Spreads and storage margins across ten markets to 2050, with the arbitrage case beside an indicative aFRR and FCR layer.
NPV, IRR and LCOE distributions per asset, straight into your own model, with every assumption exportable.
Every run begins from one of three pathways built on national plans and the decided pipeline, with TYNDP as the frame: a central case and a bracket either side. None of them is locked.
Starting points, not limits. Inside any of them you can tilt gas, carbon, demand, nuclear and storage, and scale the build-out one technology at a time. Save the result and hold it against the published default.
Gas and carbon are two of the controls in the sidebar. Drag either one and the 2030 average for any of the ten markets updates — against real model runs, not a sketch of one.
This panel needs JavaScript. The same runs are in the application itself, where every other input is a control too.
A price forecast you cannot inspect is an opinion with a decimal point. This one is built to be taken apart.
No retail build-up, so network tariffs, levies and taxes are absent and the output is not an end-consumer cost. Reserve capacity is priced as a separate layer that never moves a solved price — the batteries holding it are kept out of the day-ahead market — and is indicative rather than a bankable curve. Beyond aFRR and FCR, no capacity-market, intraday, mFRR or activation revenue is modelled.
It is a screening and second-opinion tool. If a lender needs a reliance-letter curve with a consultant's name on it, buy that instead.
Tell us the market, the technology and the horizon. We will run it and send back a sample hourly curve, on the same engine you would be using.